I met with Uila via WebEx a couple weeks ago. My Internet was down, so I had to use my phone. It wasn’t ideal for a demo style interview. If only I had some monitoring tool to help me with root cause analysis. I was blaming the cable company, it was usually their fault. We only had a half hour scheduled, and at the 30 minute mark we all decided that a longer session would be necessary.
Uila, with customers in a myriad of verticals, deems itself an “Enterprise-ready, application-centric infrastructure monitoring and analytics solution for private and hybrid cloud environments.” I actually think that’s selling it a little short. I’d probably fit the word “workload” in there somewhere, to give folks the idea that it’s more than just an infra/ops solution. When I asked them what their elevator pitch was in person they named three important things:
- Bridging gaps between silos
- Root cause analysis
- Getting rid of back and forth “finger pointing”
Okay, technically those are all the same things, but important none the less.
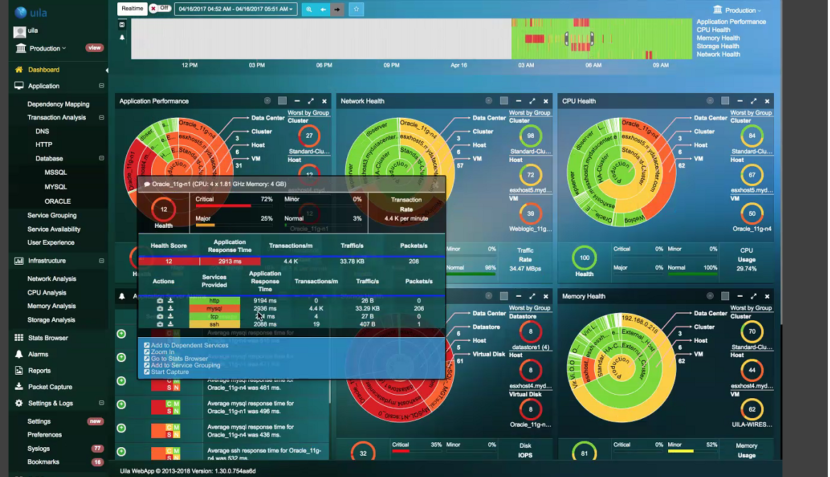
Dashboard
We started off with the obligatory view of the dashboard, which upon first glance was a little busy, but after a very quick eye adjustment came alive to me. Honestly, the way they’re portraying information on the dashboard is colorful, original, and elegant. It’s still just heat maps and color wheels, but the way they’re used is very intelligent. It’s easy from these color wheels and heat maps to see which object, cluster, or application is “in the red” quickly.
Everything is clickable, of course, to allow for diving deeper into any problematic areas you might spot using the dashboard, there are alerts/notifications as well if your eyes can’t be glued to the dashboard. Clicking deeper and deeper to find root cause did remind me of vRealize Operations, but for the entire stack with an application centric perspective. Uila assured me that this product is meant to be used alongside products like vRealize Operations and similar products from other vendors. It obviously works with VMware vCenter, but I’m told it will work with basically anything you’ve got (Hyper-V, OpenStack, and public cloud vendors). I’m skeptical of what that means, after a quick glance at the website, but as with anything I’m sure you can “do it through the APIs.”
Root Cause Analysis
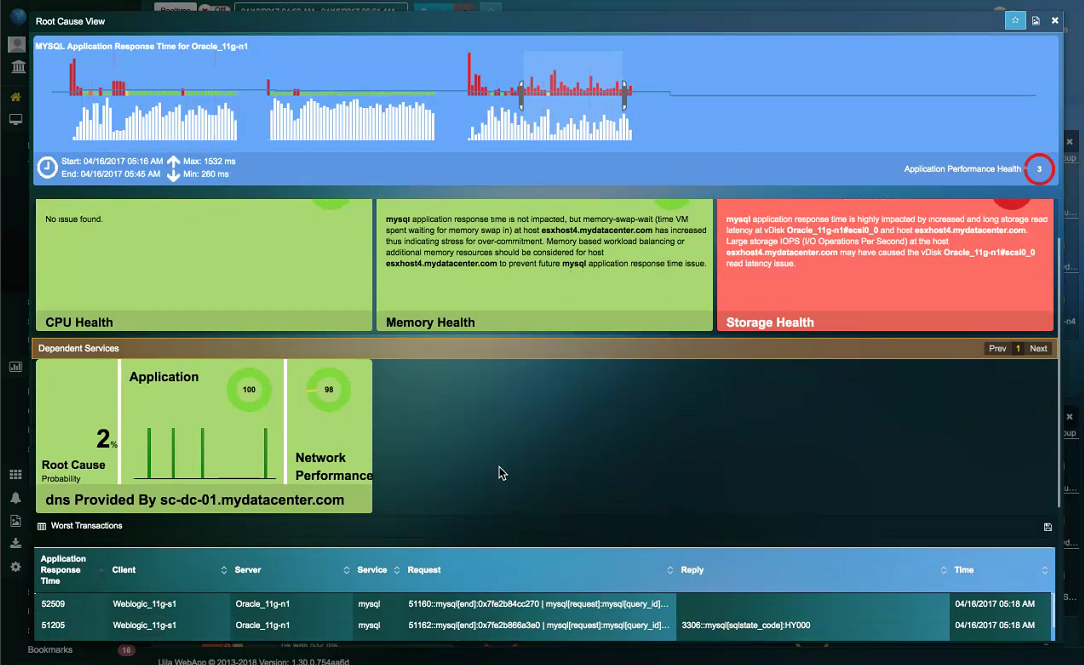
As mentioned above, you can keep clicking deeper beyond the dashboard to eventually find what problems are. Let’s take a use case – we can see right from the dash board what the worst transactions are from an application perspective. We see a certain DB is running slow within a given application.
![]()
We also know, because of Uila’s Baseline feature, that these transactions may be abnormal. Instead of blaming the database folks right away, though, let’s click deeper, and eventually find it’s a datastore issue on an ESXi host. Now that we know that, we can check things like what other VMs are on this datastore (noisy neighbors) and right size either by adding infrastructure or moving VMs around.
Application Dependency Mapping
ADM is an area I’ve become very interested in, mostly because I think everything in the future will require that we have a very detailed knowledge of what every application looks like. This could be for micro-segmentation/security purposes, performance, or migration purposes. Surprisingly, not many companies know what their applications look like which has been a barrier to entry for many “software-defined” solutions. Uila offers this through visuals like the one below.
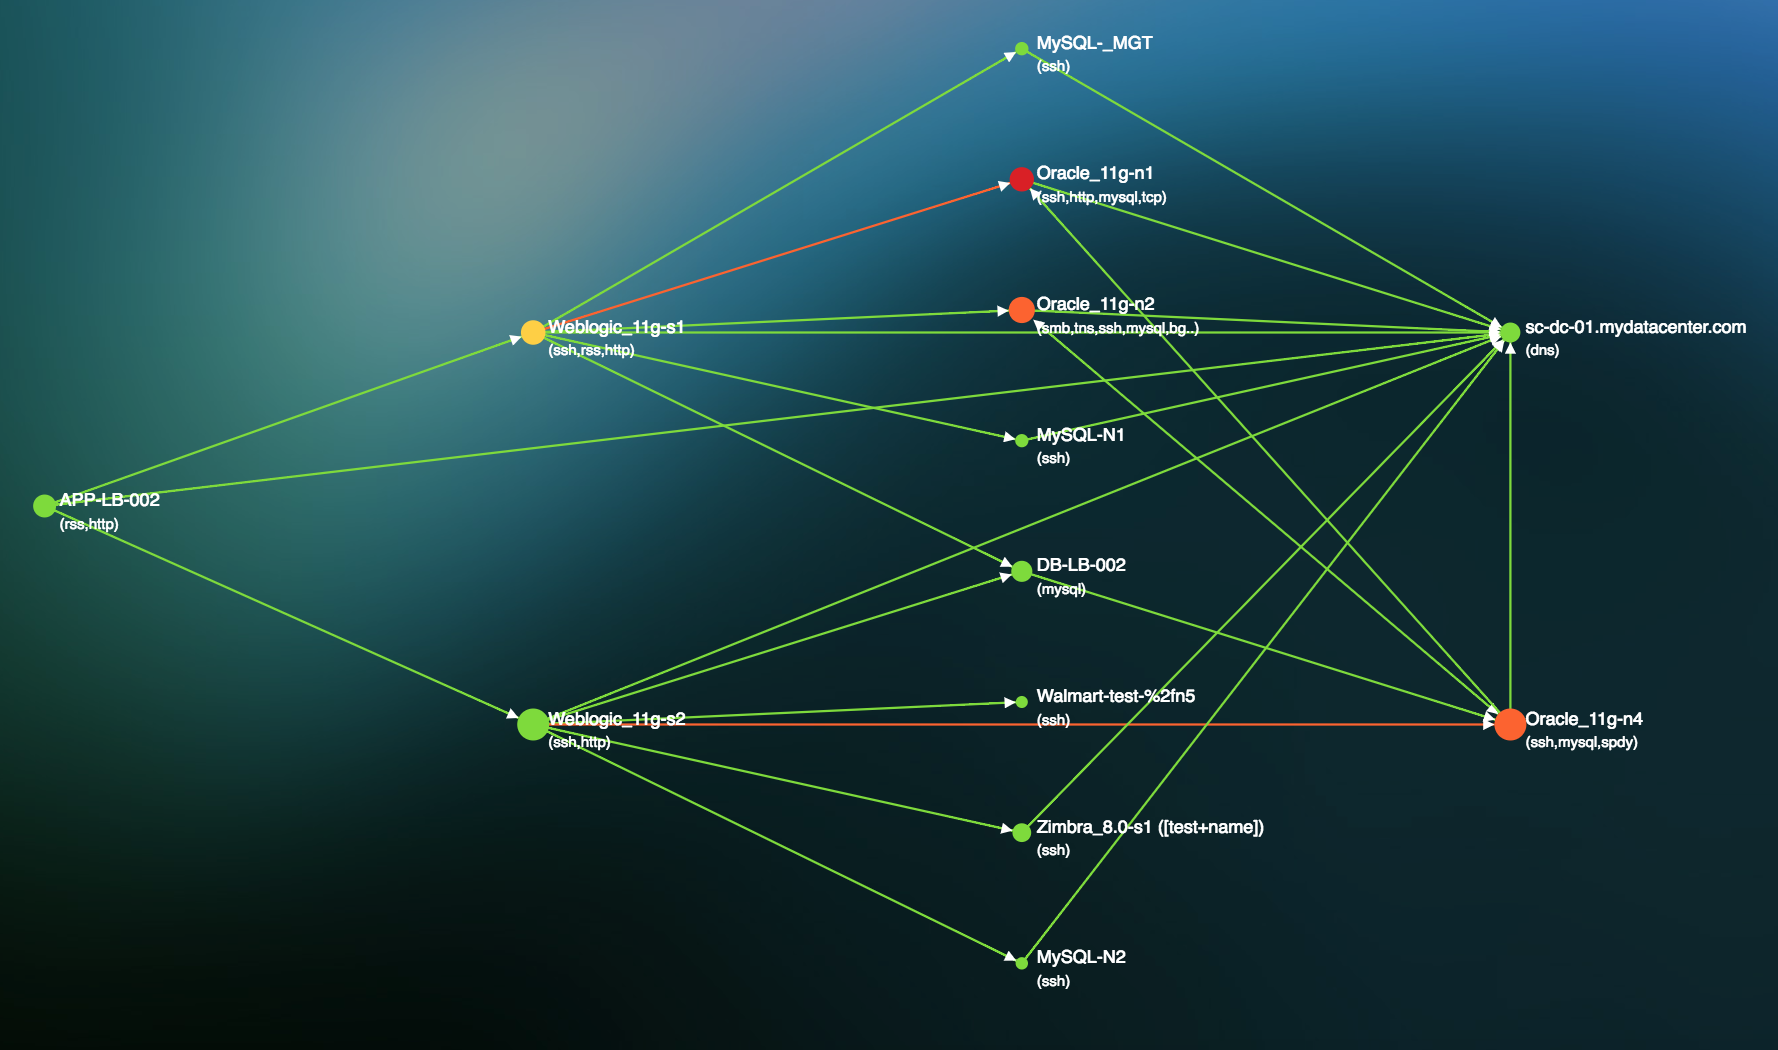
As with a few other areas of the product, it also offers the ability to download a CSV file. This helps with things like documentation and is helpful when coming up with a plan for migration. I personally think this could be really useful if you wanted to automate a migration. You could even just put the CSV file in Postman and let it run. There’s more to it than that, but definitely something to think about.
ADM is not easy, and traditionally hasn’t been done well by software, which leads to companies having to spend hundreds of thousands of dollars getting consultants to do ADM for them. Inevitably, that information is usually dated by the time you get the finished report. I hope this, and other ADM products like this, lead to making customer’s lives much easier.
Finding Bottlenecks
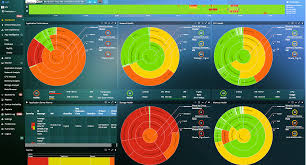
No matter which silo you belong to, bottlenecks are problematic. Uila offers CPU analysis, network analysis, storage analysis, and memory analysis. The CPU and memory analytics visuals look like the visual below:
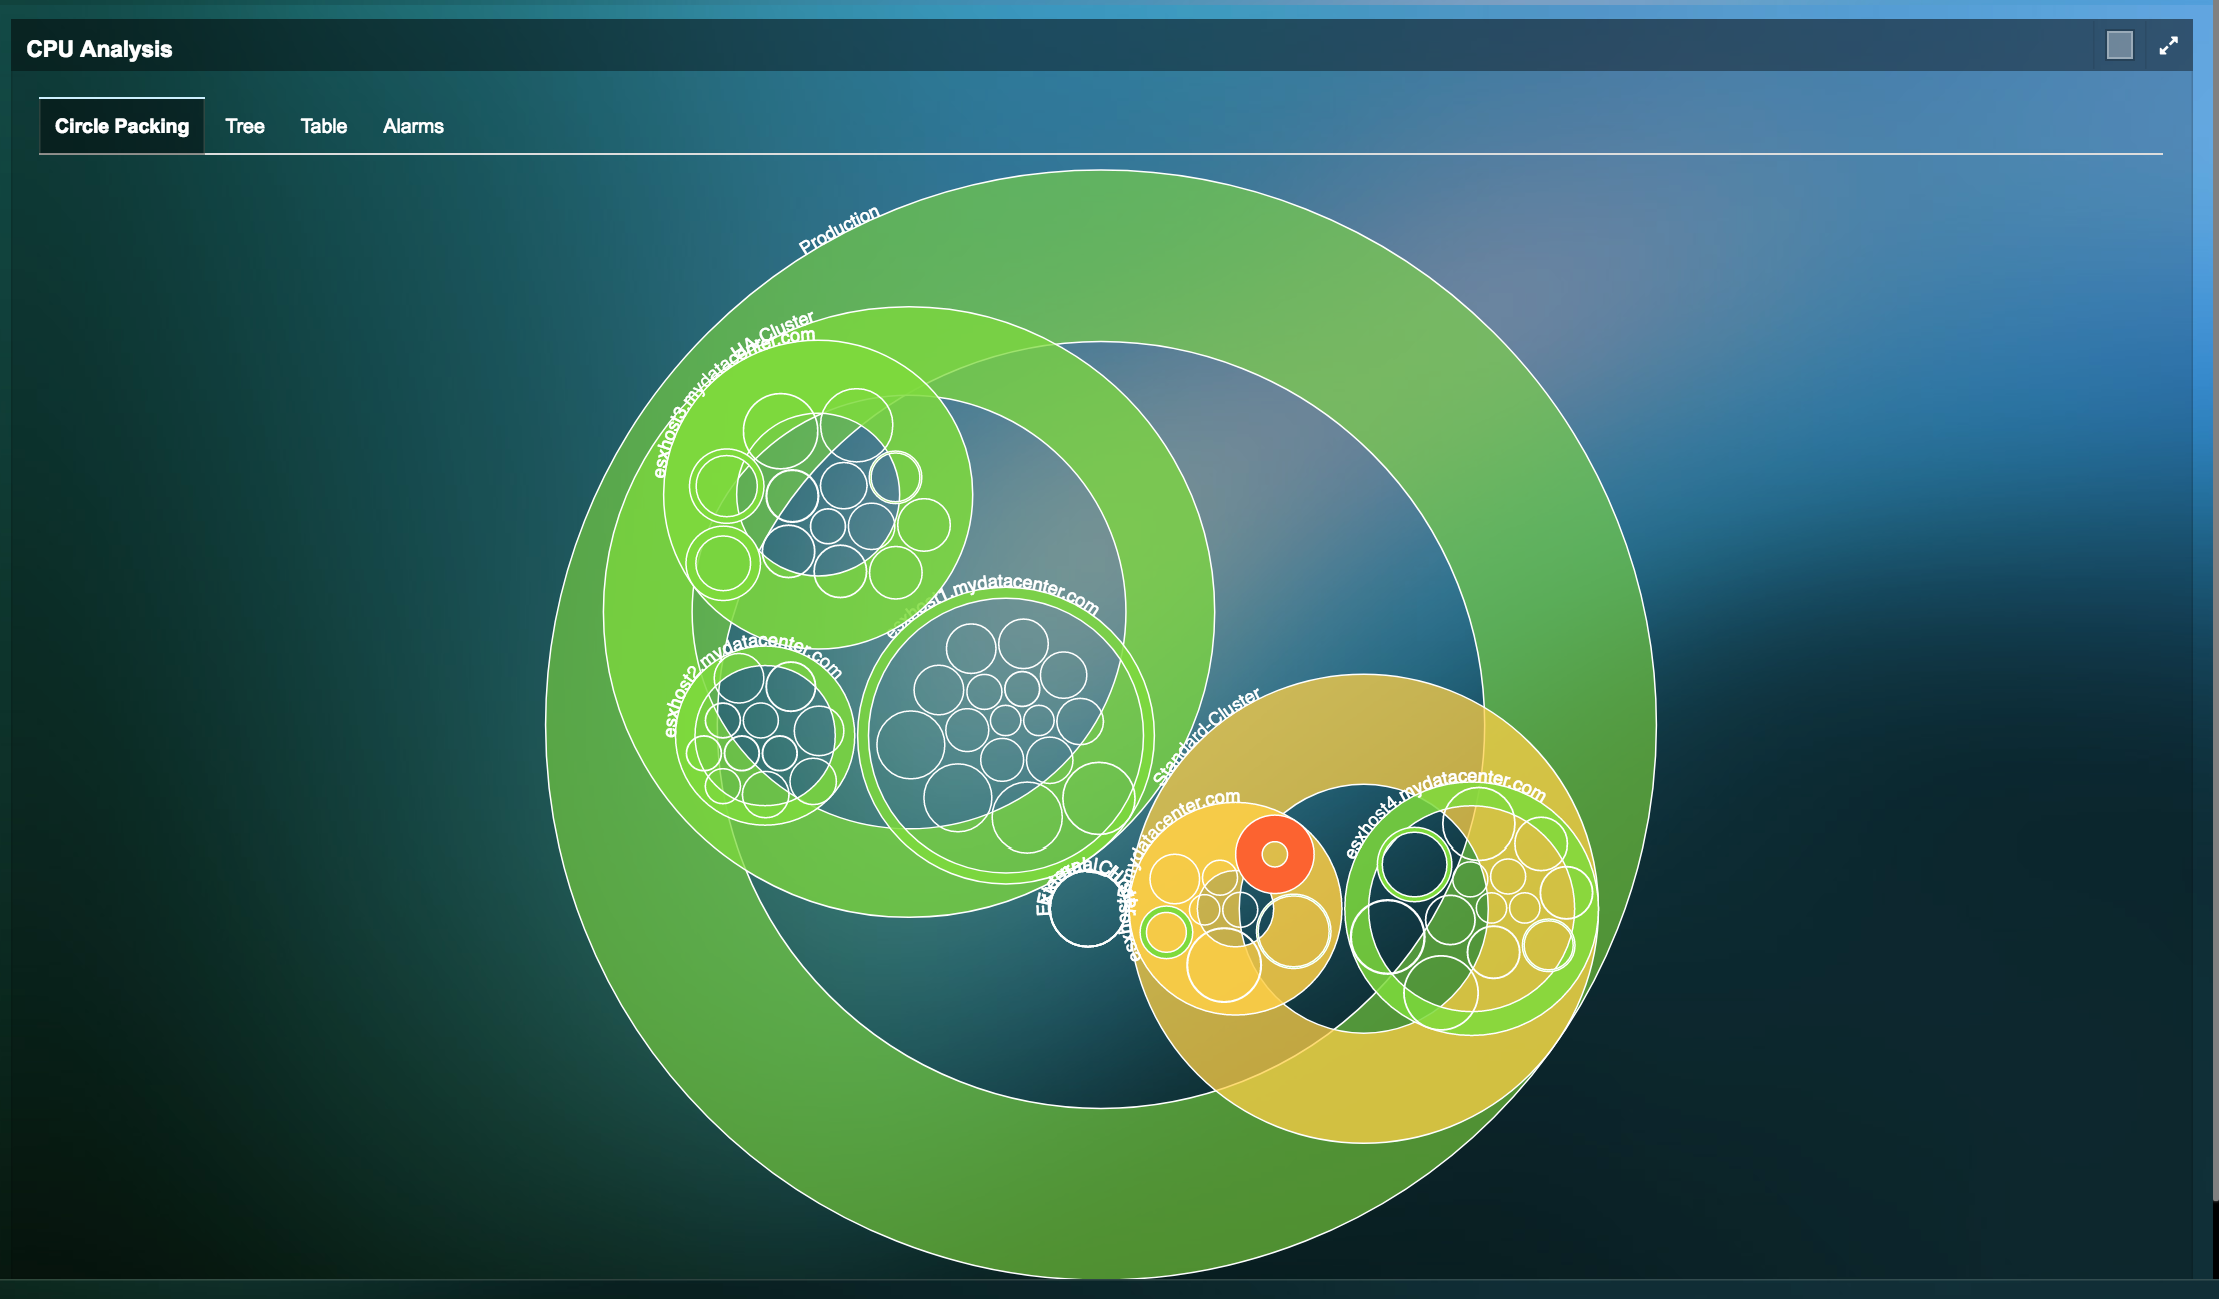
These series of circles represent VMs, hosts, clusters, and applications, all relative to size. We can see a small orange circle, representing a high CPU load on that VM, ultimately resulting in a CPU load on the host, and so on.
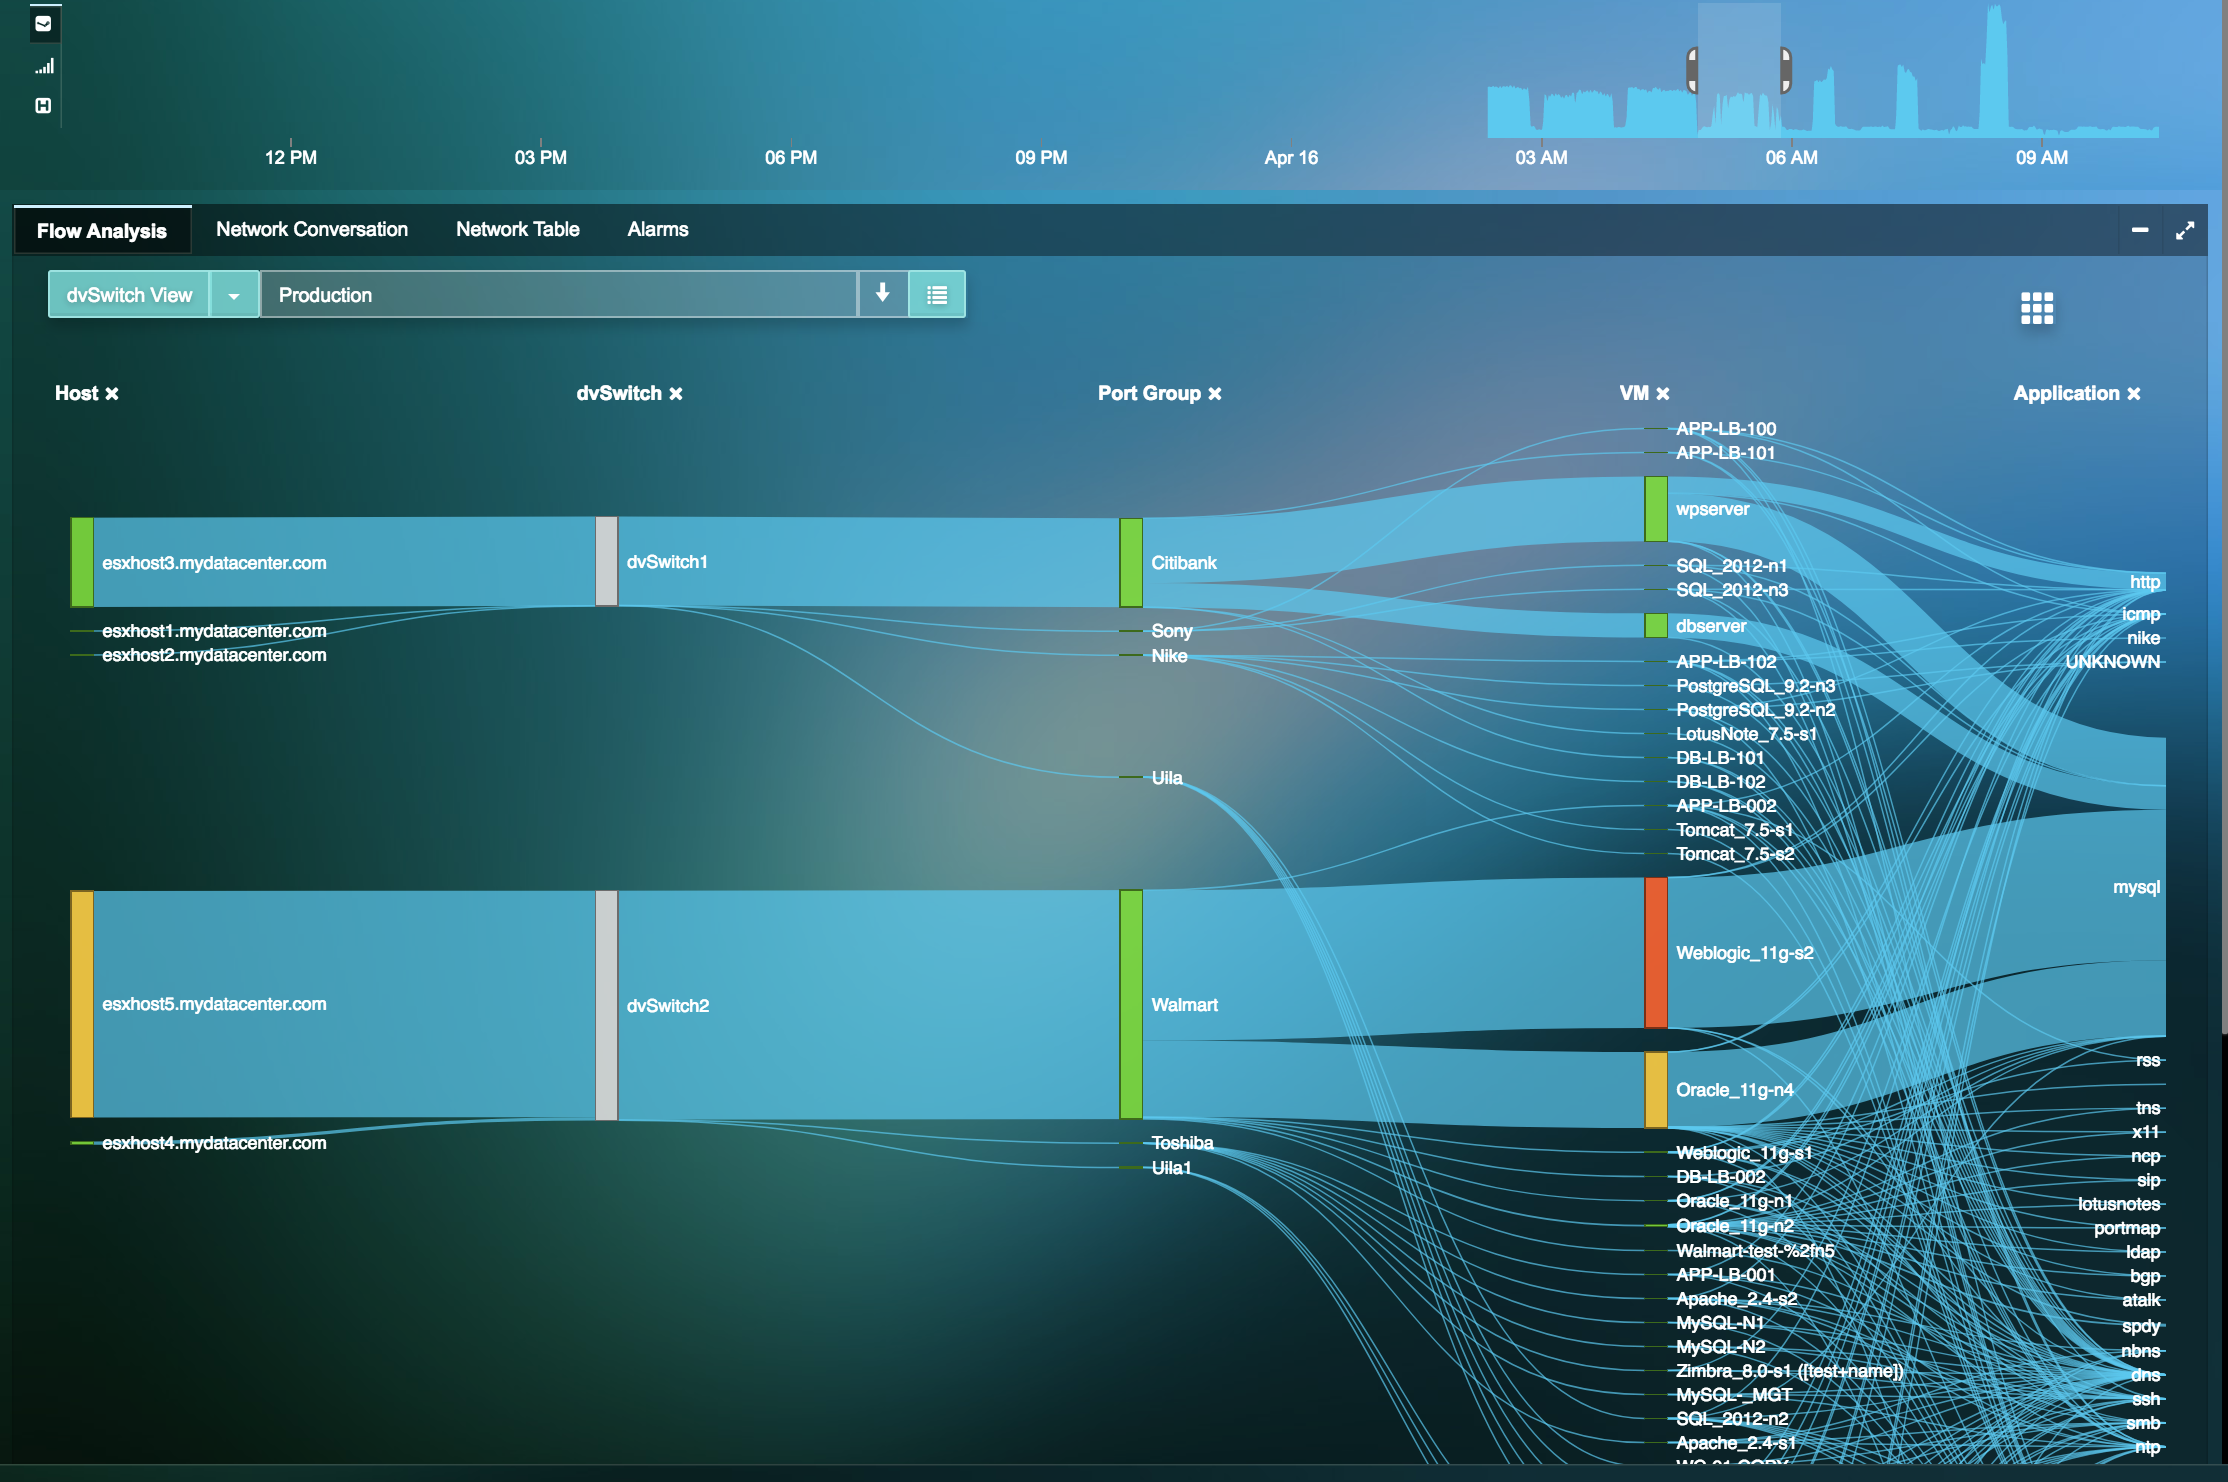
In the next visual we see what network analysis looks like (the storage analysis looks like this as well). I love this visual for the network because it really looks like some bundled cables all going out to individual ports. From the vertical lines we can easily see where bottlenecks are, and hover over things to get more details.
Transaction Analysis
This is the last thing I’ll cover, though, Uila has plenty more features to explore, which you can do because they offer an interactive demo on their website. The Transaction Analysis feature makes analyzing and monitoring common services easier. Just to list a few of these services: DNS, HTTP, Database, and User Experience.
I was shown the DNS transactions, which are fully searchable. These are all time stamped and can help you glean information about whether users are hitting incorrect DNS servers, or transaction time analysis, etc. I also saw perhaps a security possibility there, but they were careful not to let me go to far on that one. There’s a definite line between performance monitoring and security monitoring. But it could at least help.
![]()
We ended with user experience, which could mean a lot of things. In this case it was the ability to plug in a source and destination and see where bottlenecks are specifically between the two. What I liked about this is that it could be an entire site, or by simply specifying a single IP with a /32, you could perhaps do some quick troubleshooting for VIP users as well.
Performance Monitoring as a Whole
APMs and infrastructure performance monitors are very important and will only become more important in our future tech landscape. Uila does a holistic job of helping IT troubleshoot. While I see it as more of a tool for Ops folks currently, I can see it quickly being used by developers as well and I would recommend to Uila that they should help the devs and their customers along that path.
In case you were wondering, a reboot of my computer fixed my original Internet issue in the first meeting, so it wasn’t the cable company after all. I suggest tech folks start seriously considering Uila and products like it, because ultimately, when customers even get the hint of a bad user experience, there will be a different finger directed at IT.